
 SignalLive
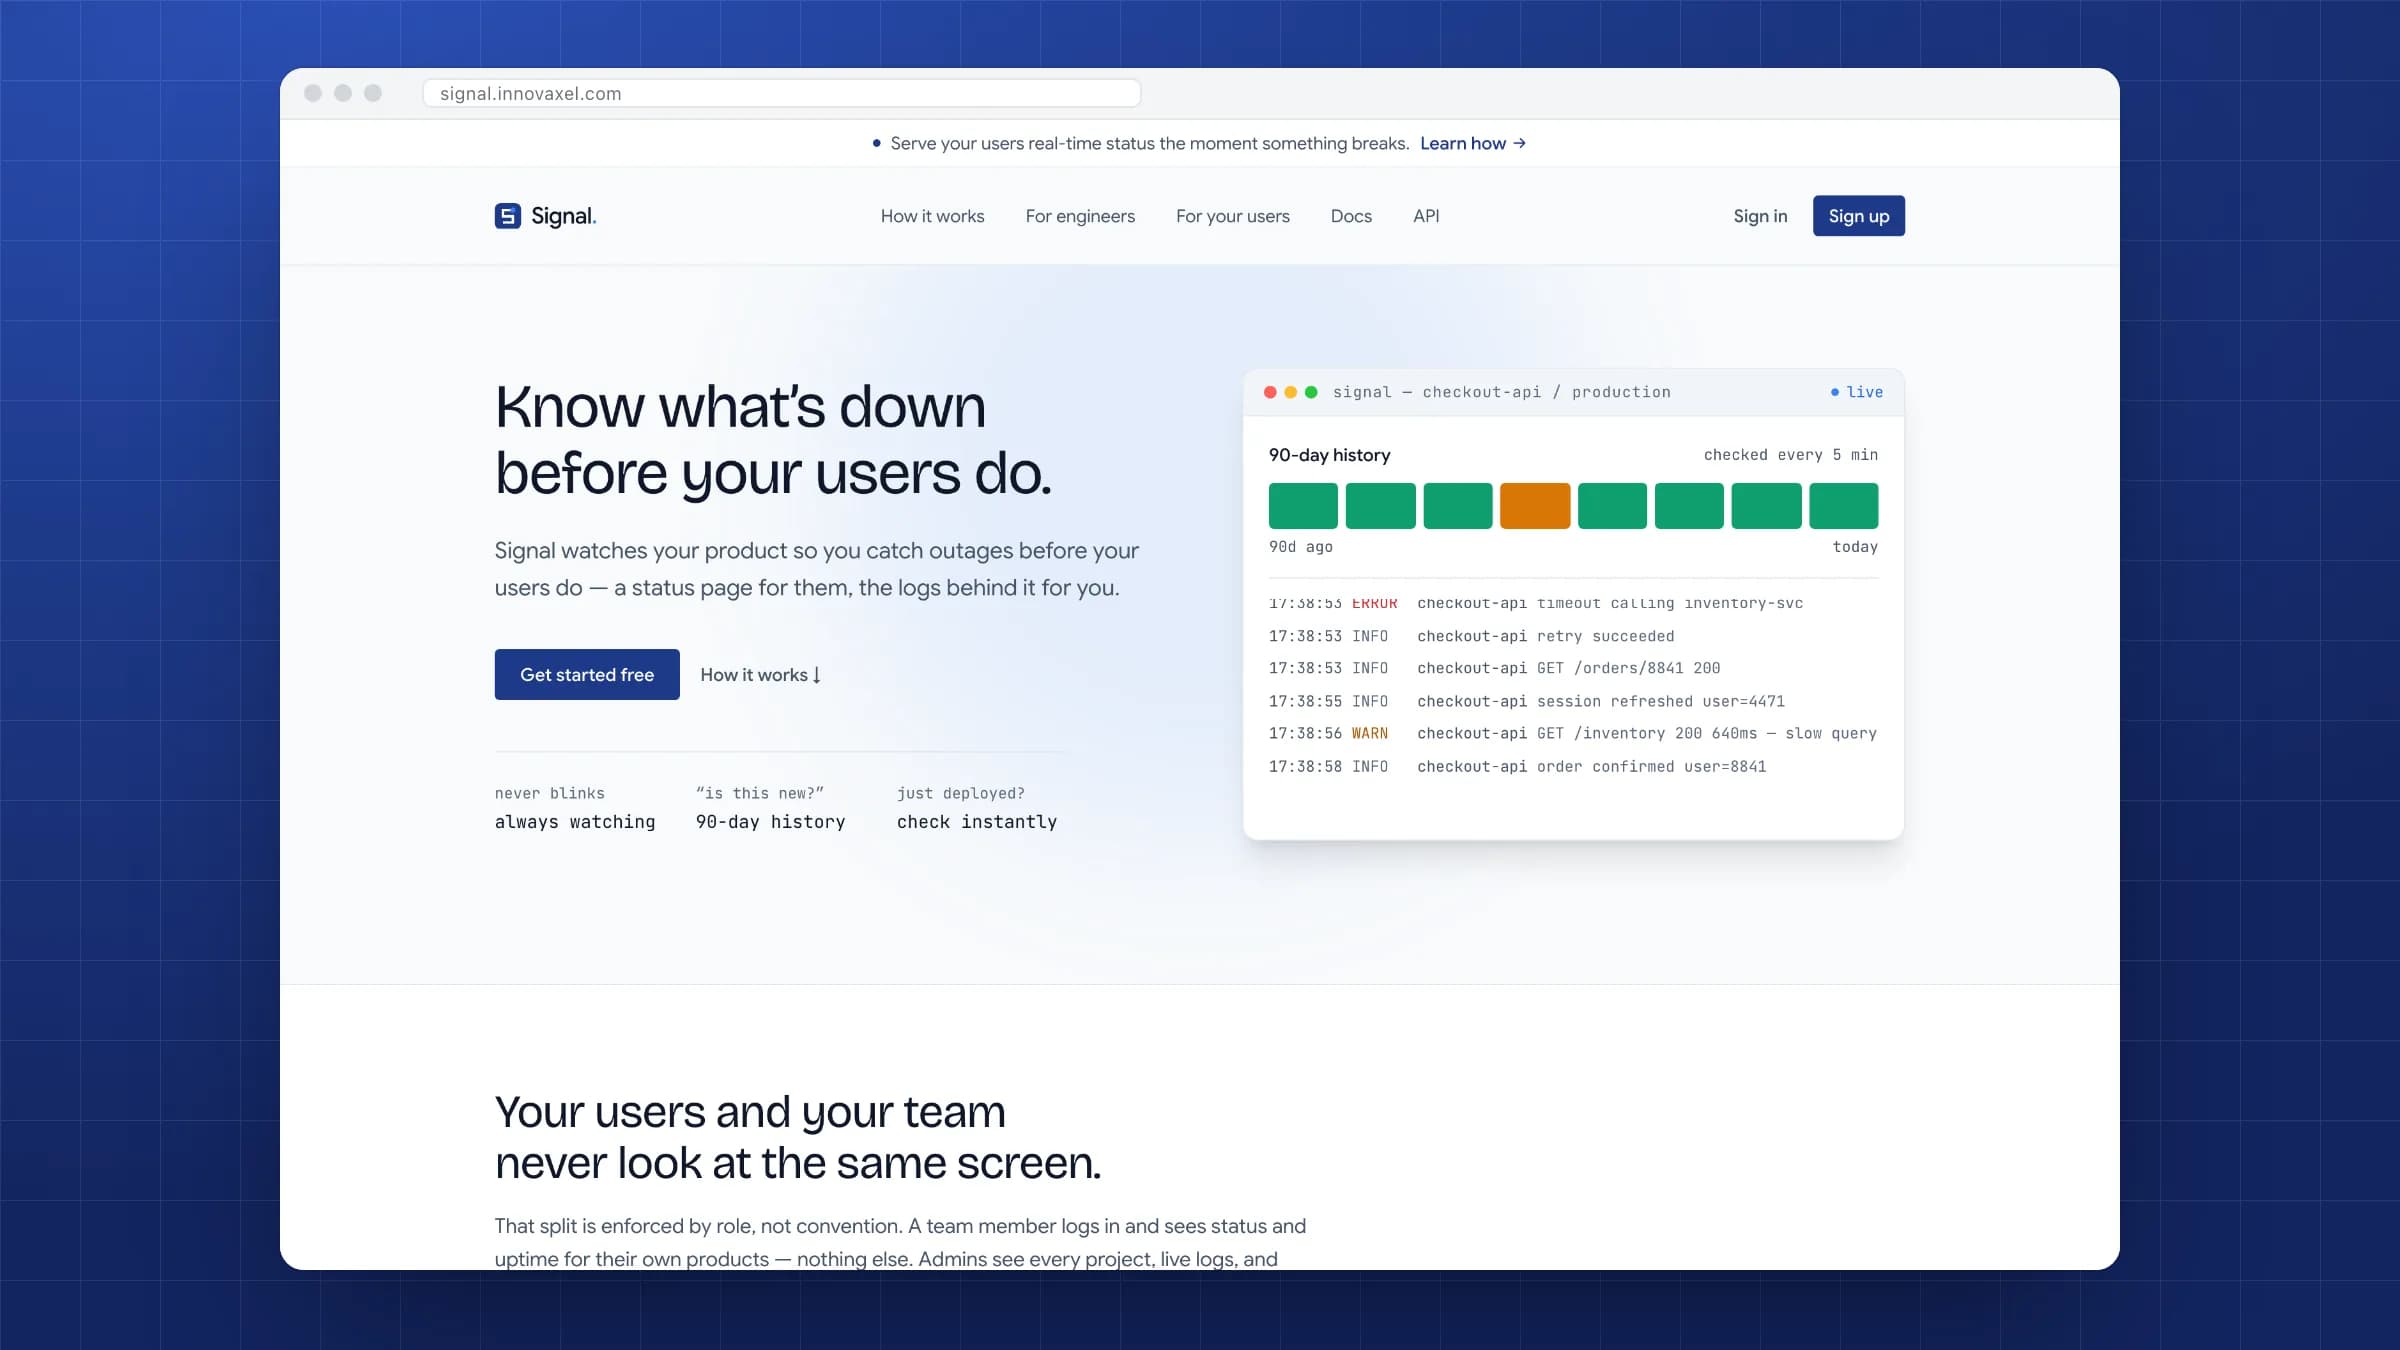
Uptime, logs, alerts, and status pages in one workspace — watching this website
A self-serve operational control plane: uptime checks and centralised logs for every product, heartbeat and Docker events for every server, email, Slack, and webhook alerts, and a branded public status page. Django, Channels, and Celery behind a React dashboard with a live WebSocket log tail.
- Industry
- DevOps & Infrastructure
- Market
- Worldwide
- Platform
- Web
- Engagement
- In-house product
- Live at
- signal.innovaxel.com
The short version
The problem
Small teams often hear about an outage from a customer, then piece it together across four tools.
What we built
One workspace for uptime checks, searchable logs, server heartbeats, alerts and a public status page.
Where it is now
Monitoring Innovaxel production today, and open to design partners and self-hosted installs.
Outages found by customers, not by the team
The client
Signal is our own product. We built it to watch Innovaxel's production, including the site you're reading now. Small teams like ours need real monitoring, but rarely the budget or headcount to run four tools for it.
The problem
For most small teams, an outage is found by a customer. Checking up on it means one dashboard for uptime, another for logs, server metrics somewhere else, and a status page updated by hand, if anyone remembers. By the time someone has matched a failing request to the server behind it, users have already been staring at an error.
Designed around the questions on-call engineers ask
Self-serve
Add a product, a server or a teammate without operator or admin-panel access.
Strict tenant isolation
Organisation stakeholders see only their own organisation.
Logs stay private
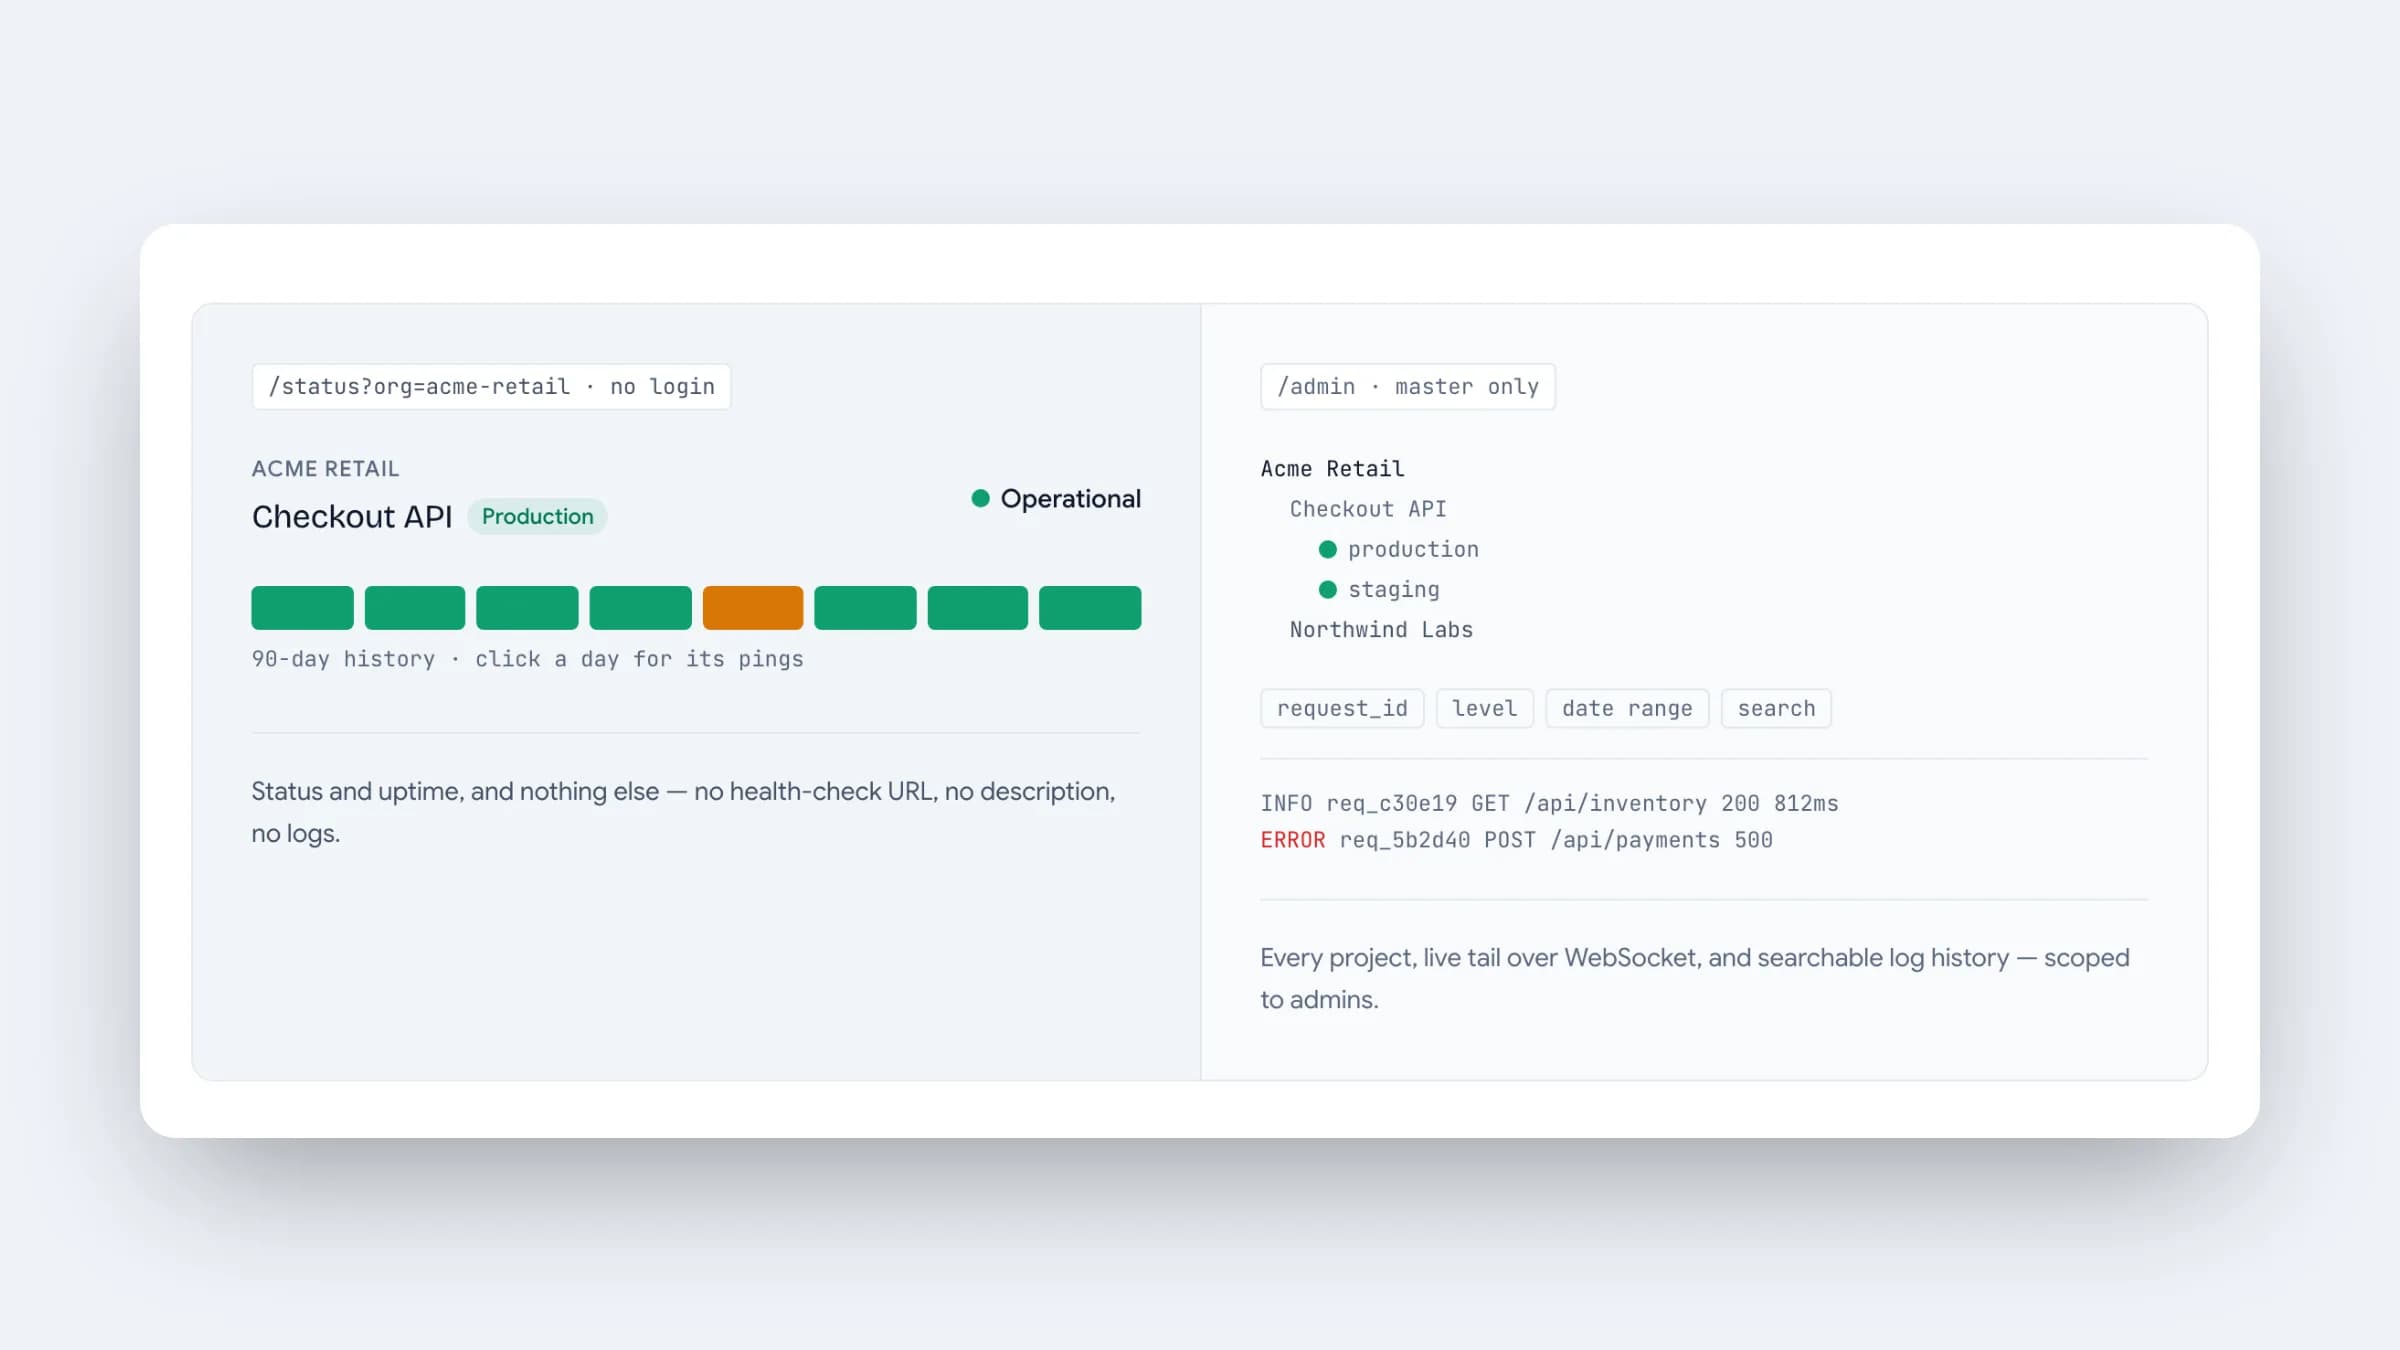
Logs are admin-only. The public status page shows status and uptime, and nothing else.
How we worked
Built and run on the same production stack it monitors, deployed with Docker Compose through CI. We started with the questions an on-call engineer asks under pressure, like "is it down?", "since when?" and "which request?", and designed each screen so the answer is scannable at a glance.
Four things we shipped
1Watching our own sites
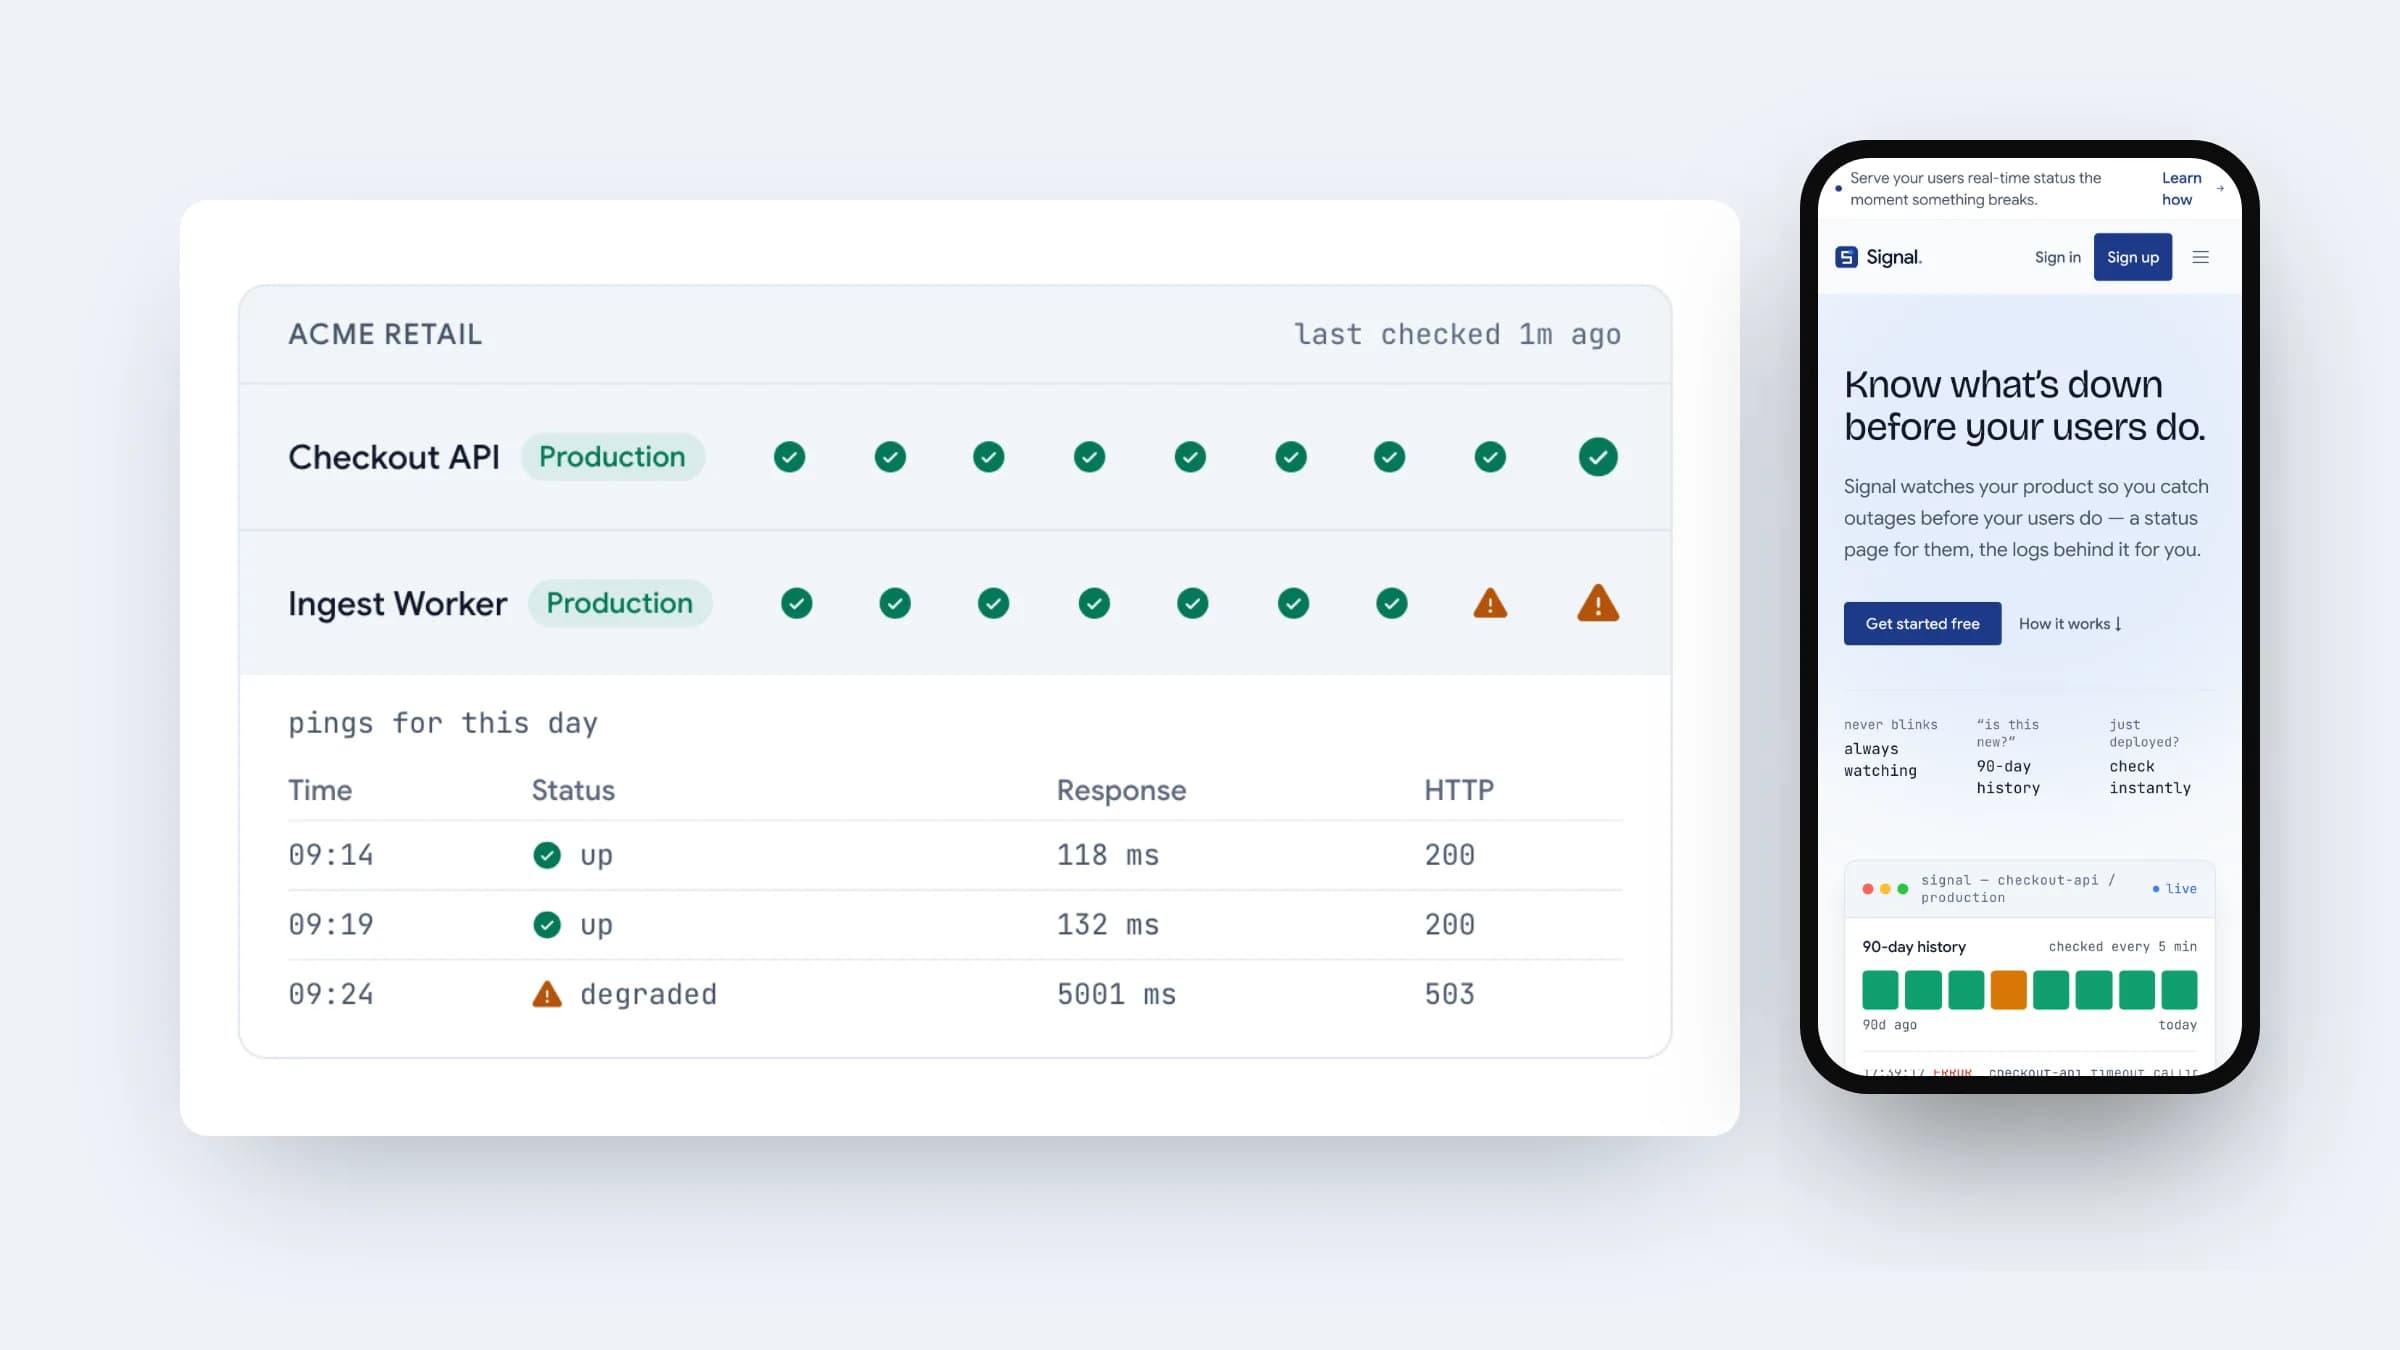
Live in production, health-checking Innovaxel's own sites every five minutes, including innovaxel.com and Peoplance
2Searchable logs, live tail
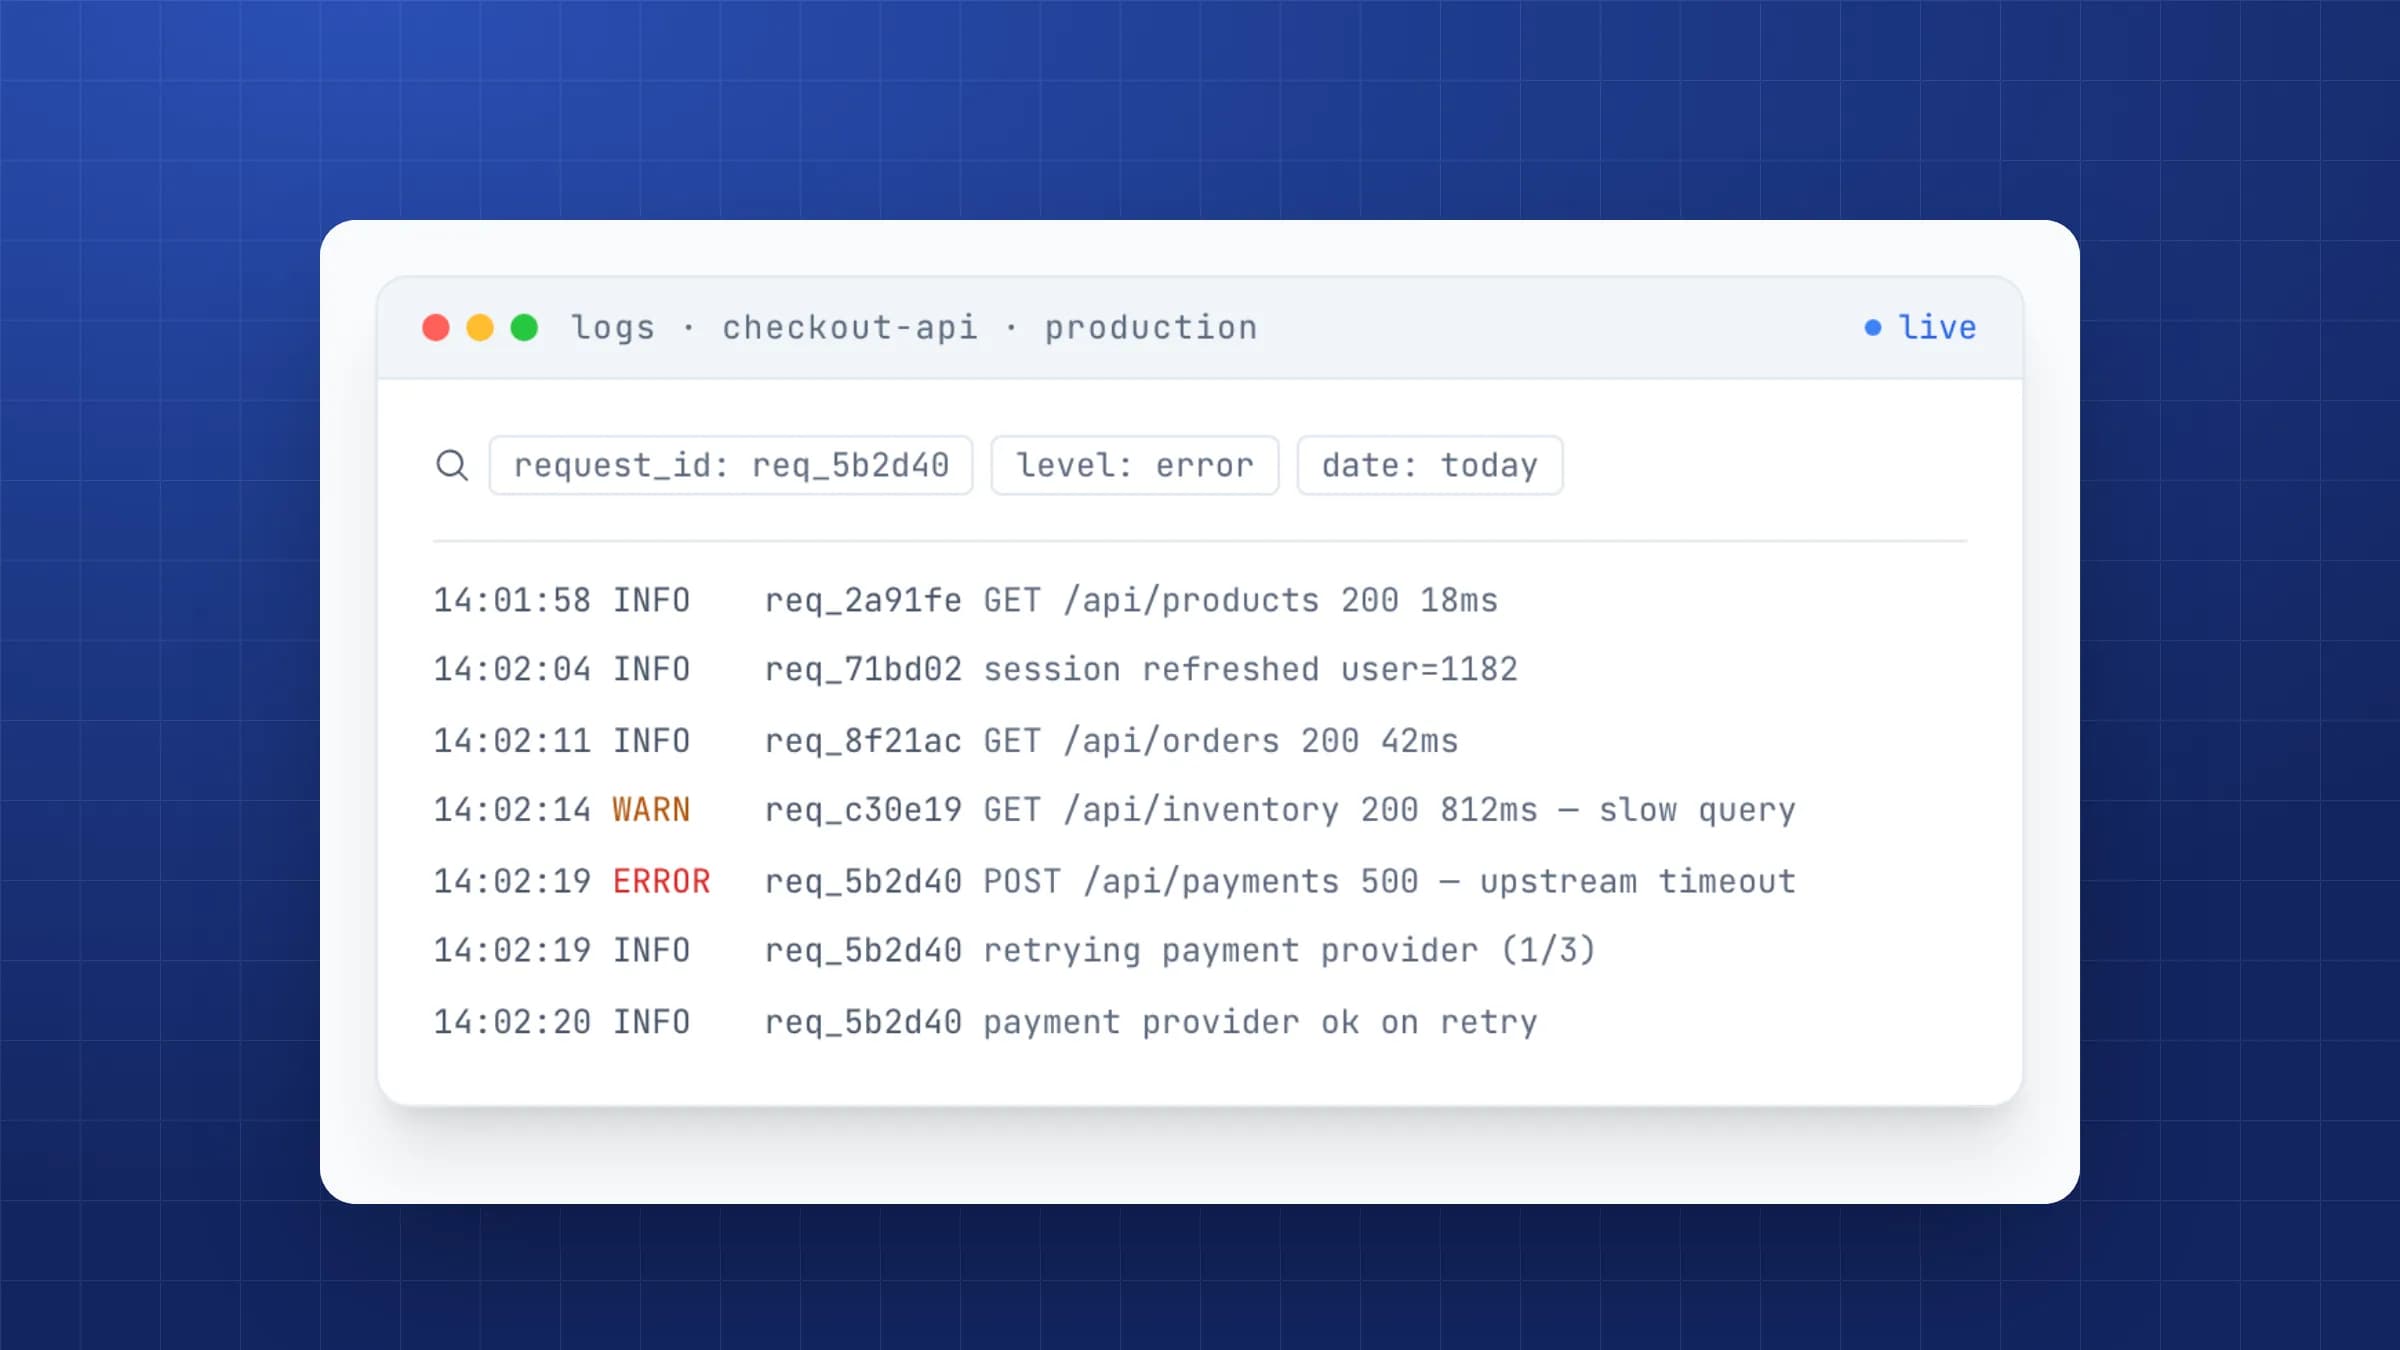
Every log line searchable by request ID, level, date range, or free text, with a live tail pushed over WebSocket
3One lightweight agent
One lightweight Python agent ships logs, CPU/RAM/disk heartbeat, and real Docker container events, and flags a server that goes quiet within three minutes
4Public status page
Branded public status page with 90-day history and human-written incident and maintenance updates
What it runs on
Frontend
- React
Backend
- Django REST Framework
- Django Channels
- PostgreSQL
- Redis
- Celery
Agent
- Python
Delivery
- Docker
What we did
- Product Design
- Web application development
- Real-time log streaming
- Monitoring agent
- Multi-tenant architecture
- CI/CD
- MVP
What happens next
Monitoring Innovaxel production today, and open to design partners and self-hosted installs. If your team finds outages from customer emails, this is the setup we’d put in place first.
Try it live
Finding out about outages from customers?
Tell us what you run and where it lives. We’ll reply with a one-page plan within 48 hours.
- 1We review your brief
- 2You get a call confirmation
- 3Walk away with a 1-page build plan